Fuzzing RDPEGFX with "what the fuzz"
Last year, in 2021, Valentino Ricotta performed his first internship with us working on fuzzing RDP clients. He found some vulnerabilities and got four CVEs by fuzzing various RDP clients. Most of his work was presented here in a three blog posts series. Valentino’s setup was built around WinAFL and, despite his successes, had some inherent limitations:
- some channels were not available;
- some crashes were linked to an unknown internal state of the target, and thus not reproducible;
- some invalid messages triggered a connection reset that negatively impacted the rate of the fuzzer.
Conveniently, that summer, @0vercl0k released what the fuzz (wtf), described by the author as “a distributed, code-coverage guided, customizable, cross-platform snapshot-based fuzzer designed for attacking user and or kernel-mode targets running on Microsoft Windows”. Unfortunately, Valentino had finished his internship and would not return before the following spring to work on another subject.
With some time off a few months later, we decided to give wtf a chance and revisit Valentino’s work to try to circumvent some of its limitations. In this blog post, we describe that endeavour and show how we took advantage of wtf’s flexibility in order to efficiently fuzz the RDPEGFX channel of Microsoft RDP client and uncover CVE-2022-30221.
This work was presented at Hexacon 2022 (slides, video).
RDP and the Graphics Pipeline Extension
We will not present Microsoft’s Remote Desktop Protocol (RDP) as it has already been discussed here. The only thing to know is that RDP is not limited to forwarding keyboard and screen between a client and a server, but can also forward various devices through specific channels as well as define extension to those channels.
RDPEGFX is such an extension, the Graphics Pipeline Extension. It efficiently encodes and transmits graphical display data from the server to the client on its own channel. RDPEGFX is documented through Microsoft open specification program.
RDPEGFX defines 23 commands (Microsoft’s client implements an additional diagnostic command). They mostly flow from the server to the client and belong to five main categories:
- Cache management commands
- Surface management commands
- Framing commands
- Capability exchange commands
- Blit commands
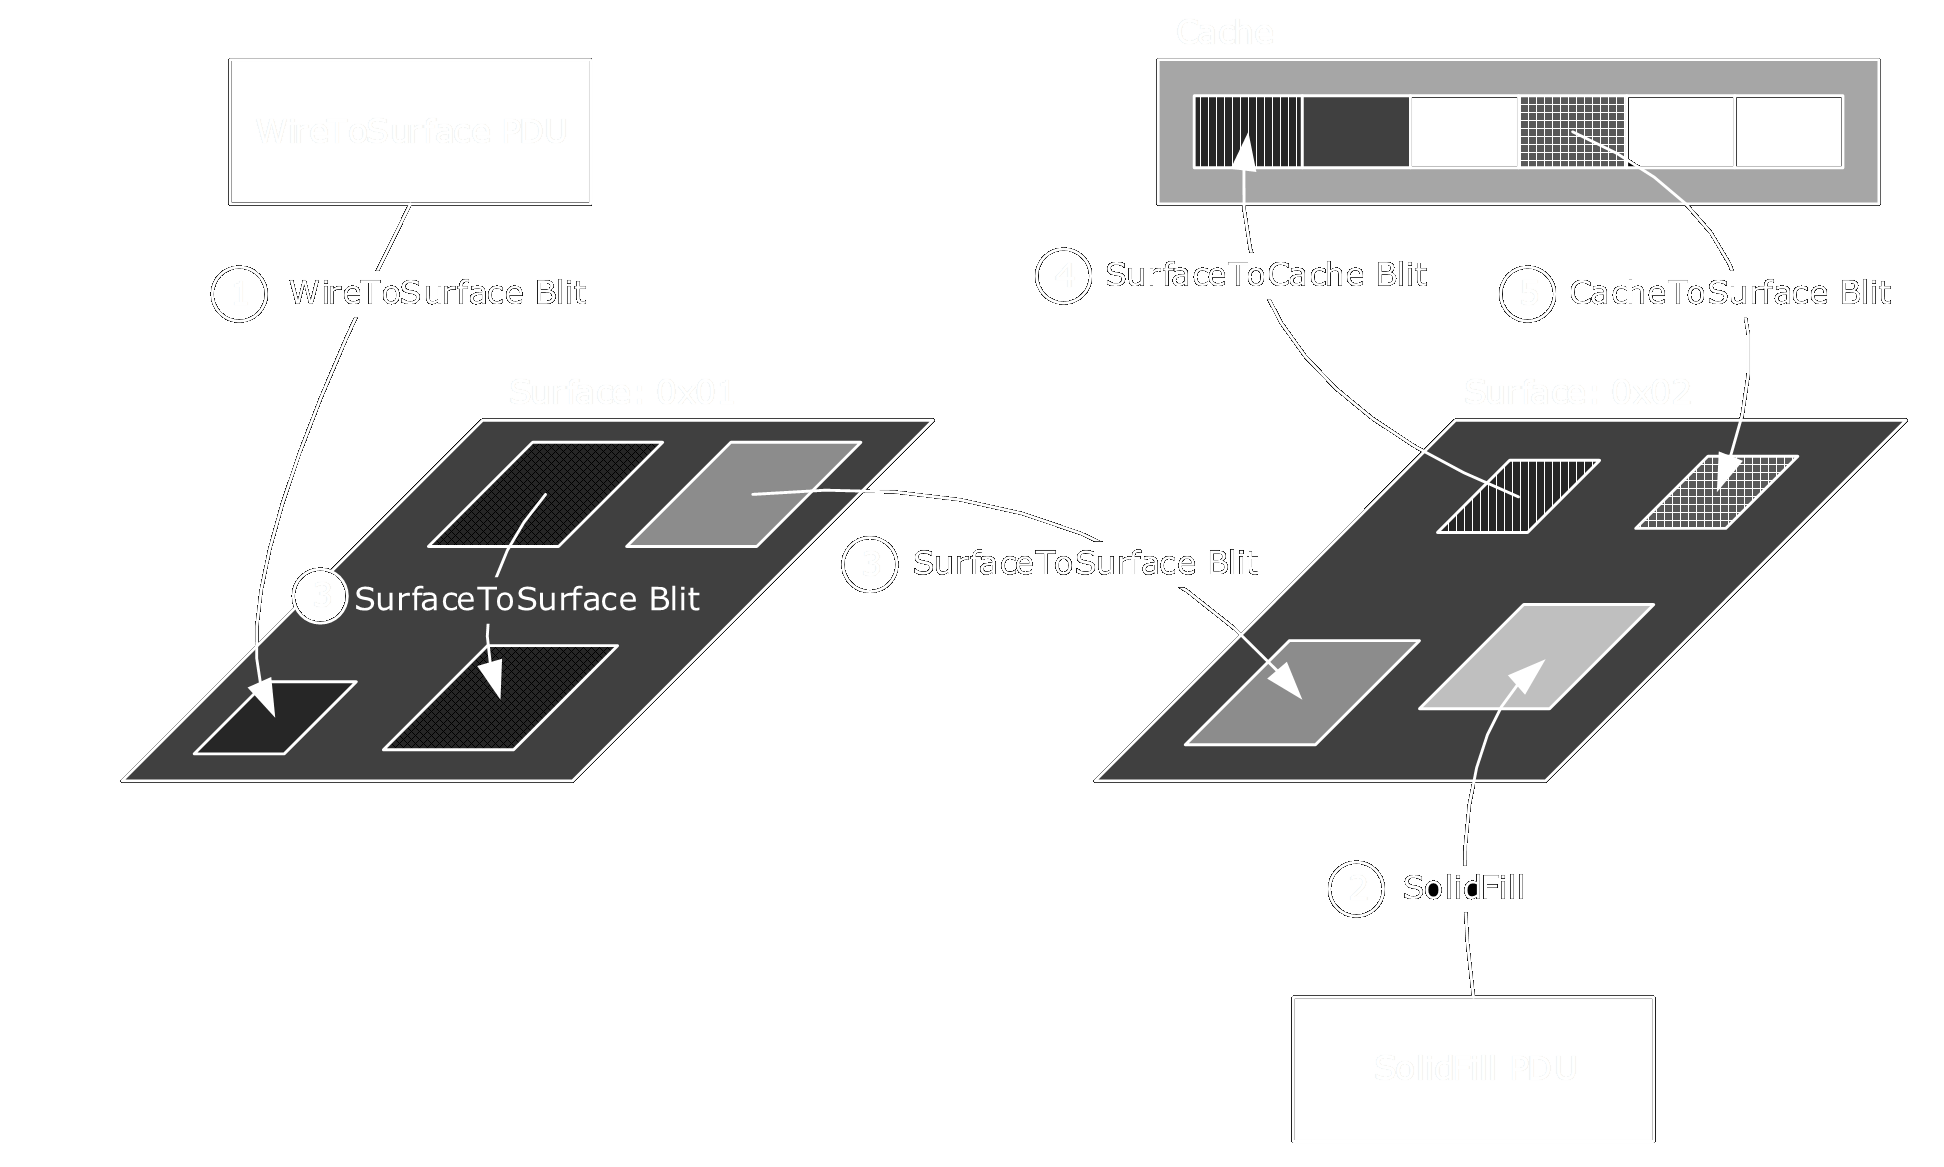
Here is an overview of the blit commands taken from Microsoft’s documentation:
One data exchange may contain several commands, referenced in the code and documentation as Protocol Data Units (PDUs). They all have a common header with a cmdId and a pduLength defining the type and length of the current command respectively:
flags does not seem to be used, and Microsoft’s documentation specifies that it must be set to zero.
We won’t need more information on RDPEGFX but interested readers can take a look at Microsoft’s documentation or the Windows Protocol Test Suites repository.
What the Fuzz
As already mentioned above, what the fuzz (wtf) is a snapshot fuzzer.
As the name suggests, snapshot fuzzers start from a snapshot (memory and CPU state) of a system running the fuzzing target.
Instead of sending inputs to the target, they are directly injected in the snapshot memory.
Then execution is resumed from the modified snapshot until a user defined condition is reached, marking all modified memory pages as dirty.
Finally all dirty pages are restored and the target is ready to receive a new input.
All of this could be used to overcome the difficulties encountered by Valentino. First, we could fuzz any channel opened in a live RDP session by taking a snapshot of the target system at the reception of a message on a channel of interest. Second, we did not have to worry about unknown internal states or random resets since we could restore the system at a known state between each execution.
Wtf is also a code-coverage guided fuzzer. During execution, the code executed by the target is collected and used to identify new code and decide if the corresponding input should be added to the corpus or not.
In wtf, executions can be performed by one of three different backends: Bochscpu, Windows Hypervisor Platform (whv), or KVM.
The main difference between them is that Bochscpu is based on emulation and uses all executed rip as coverage while KVM and whv rely on virtualization and only report not previously triggered breakpoints placed at the beginning of basic blocks, which should be more or less equivalent.
We used both the Bochscpu and KVM backends, for our purpose the whv backend should behave like the latter.
The Bochscpu backend is obviously much slower as every instructions are emulated, but offer much more control over the execution as we will see later.
Additionally, it can generate a trace of program counters (rip) or a tenet trace.
Bochscpu is the preferred backend to analyze a crash in the target or debug the harness of the fuzzer.
KVM on the other hand is much faster but can only inspect the target after a VM-exit. In order to collect code coverage one-time breakpoints are set on a collection of user provided addresses, usually the addresses of every basic blocks of the target’s modules of interest.
For a more complete presentation of wtf we refer the reader to @0vercl0k’s recounting of the birth of wtf in Building a new snapshot fuzzer & fuzzing IDA or @gaasedelen fuzzing campaign of a AAA game: All Your Base Are [Still] Belong To Us. @gaasedelen is also the author of tenet (and lighthouse) and he extended wtf to enable the generation of tenet traces in wtf.
Snapshots
Taking a snapshot does sound (relatively) easy:
- setup kernel debugging;
- switch to your process context;
- break on your point of interest;
- dump CPU and memory with bdump.js as suggested by @0vercl0k.
and voilà!
Getting a good snapshot for fuzzing purposes is harder.
First wtf relies on the CPU and memory dump only. The advantage is that traces should be deterministic as no IO operation are possible, but loading a library from disk or restoring a page from the pagefile won’t work. In order to circumvent these issues @0vercl0k developed two utilities:
- inject can be used to inject some libraries in a process memory;
- and lockmem locks every available memory regions of a given process into its working set, preventing any page fault on access.
Not knowing which libraries to inject into Microsoft RDP client, mstsc.exe, we found it easier to just first connect to a distant server to ensure all necessary libraries are loaded, then disconnect, and only create our dump at the start of a second connection.
As a side note, we found the bdump_full command of bdump.js more reliable than bdump. The only difference seems to be that bdump_full invokes .dump with the flag /f, creating a complete memory dump, instead of /ka for a dump with active kernel and user mode memory.
We did not use lockmem either. One of our colleagues suggested we start Windows in WinPE mode in order to disable pagefile.sys and port some of their IceBox code to extend wtf virtual address translation (VAT) capabilities.
Indeed the KVM and whv backends of wtf need to set breakpoints in the memory dump to record coverage before any execution. To do that, wtf needs to translate virtual addresses into physical ones. We won’t enter into the details here, but wtf implements the generic VAT case and we added the ability to access in-transition pages in pull request #136. Interested readers can take a look at Windows full memory introspection with IceBox to know more about Windows VAT and WinPE mode.
The second reason why getting a good snapshot for fuzzing purposes can be hard is more target specific. One has to ensure that the target is in the right state when memory and CPU are dumped.
As an example, our first snapshot was at the reception of the first message by the client on the RDPGFX channel, but this message must be of type RDPGFX_CAPS_CONFIRM_PDU.
Taking another snapshot at the reception of the second message greatly improved our fuzzing campaign.
First Fuzzing Campaign
The first step is to analyze the target and find the relevant code to fuzz.
We are interested in the processing of messages of the RDPEGFX channel by Microsoft’s RDP client.
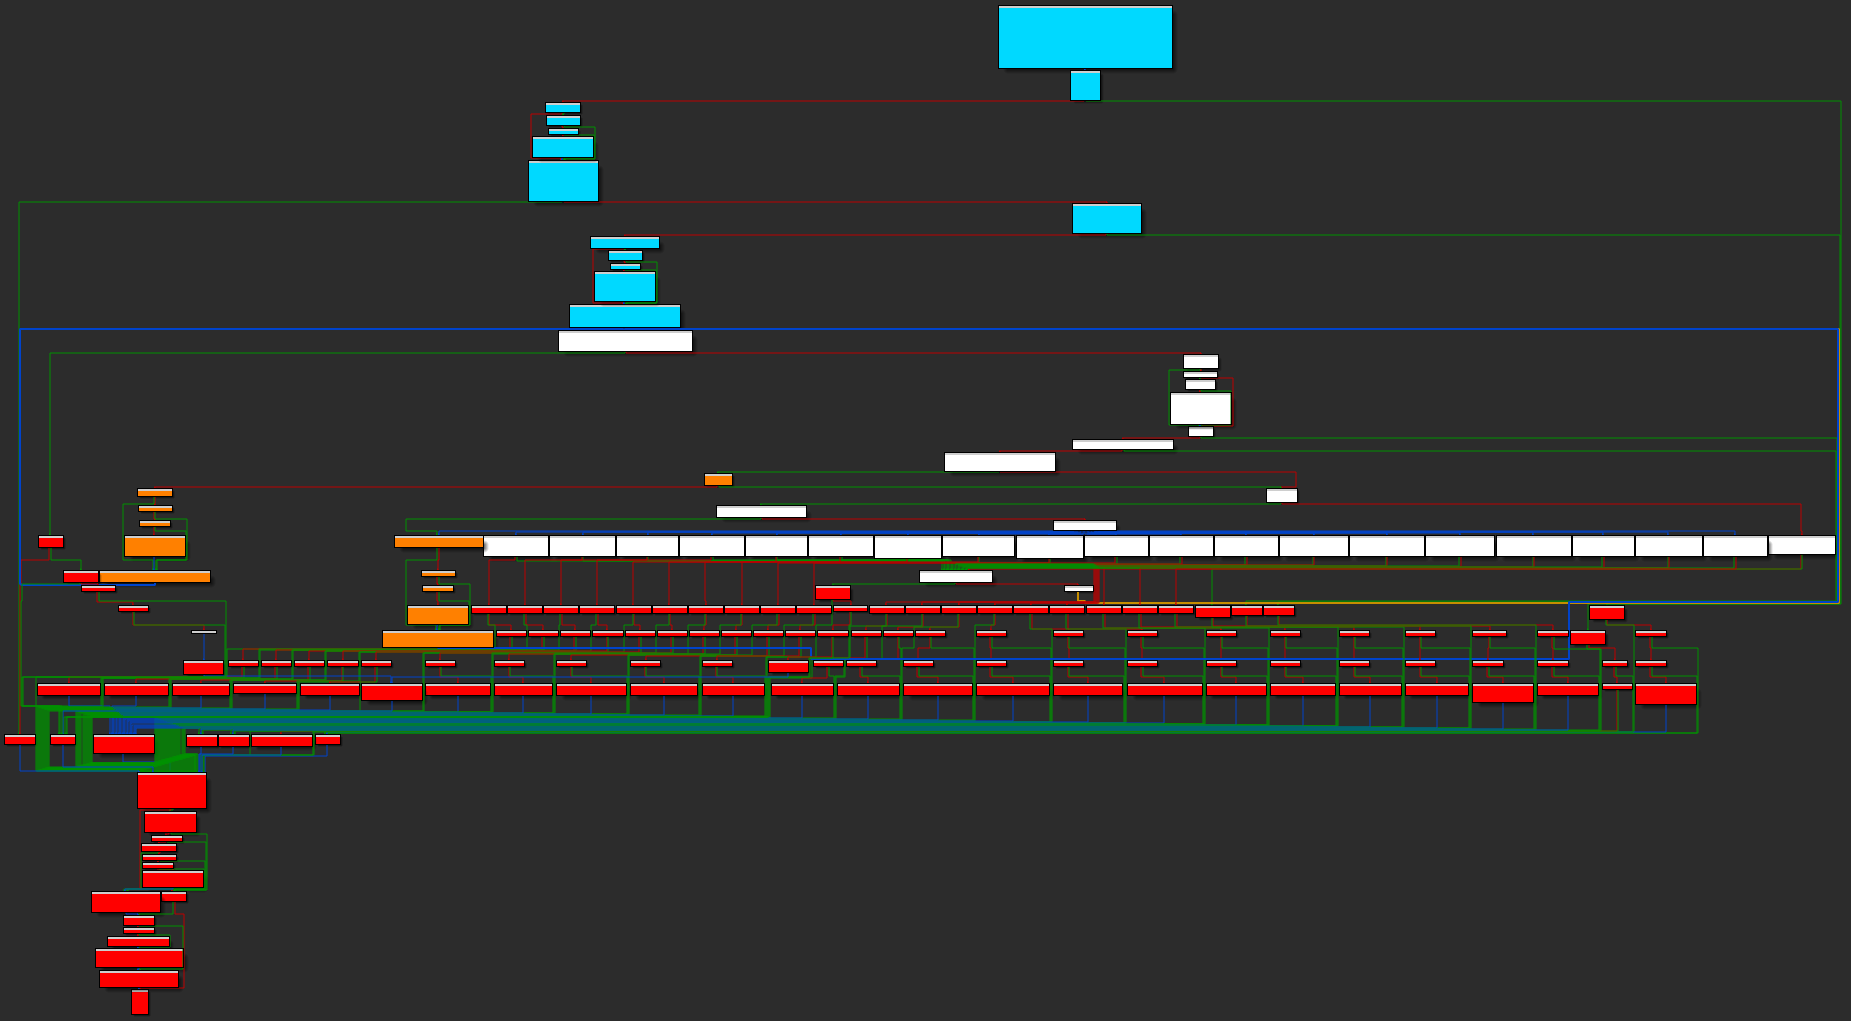
This processing is performed in the RdpGfxProtocolClientDecoder::Decode method of mstscax.dll (MicroSoft Terminal Services Client ActiveX control) whose control flow graph (CFG) is shown on the following figure:
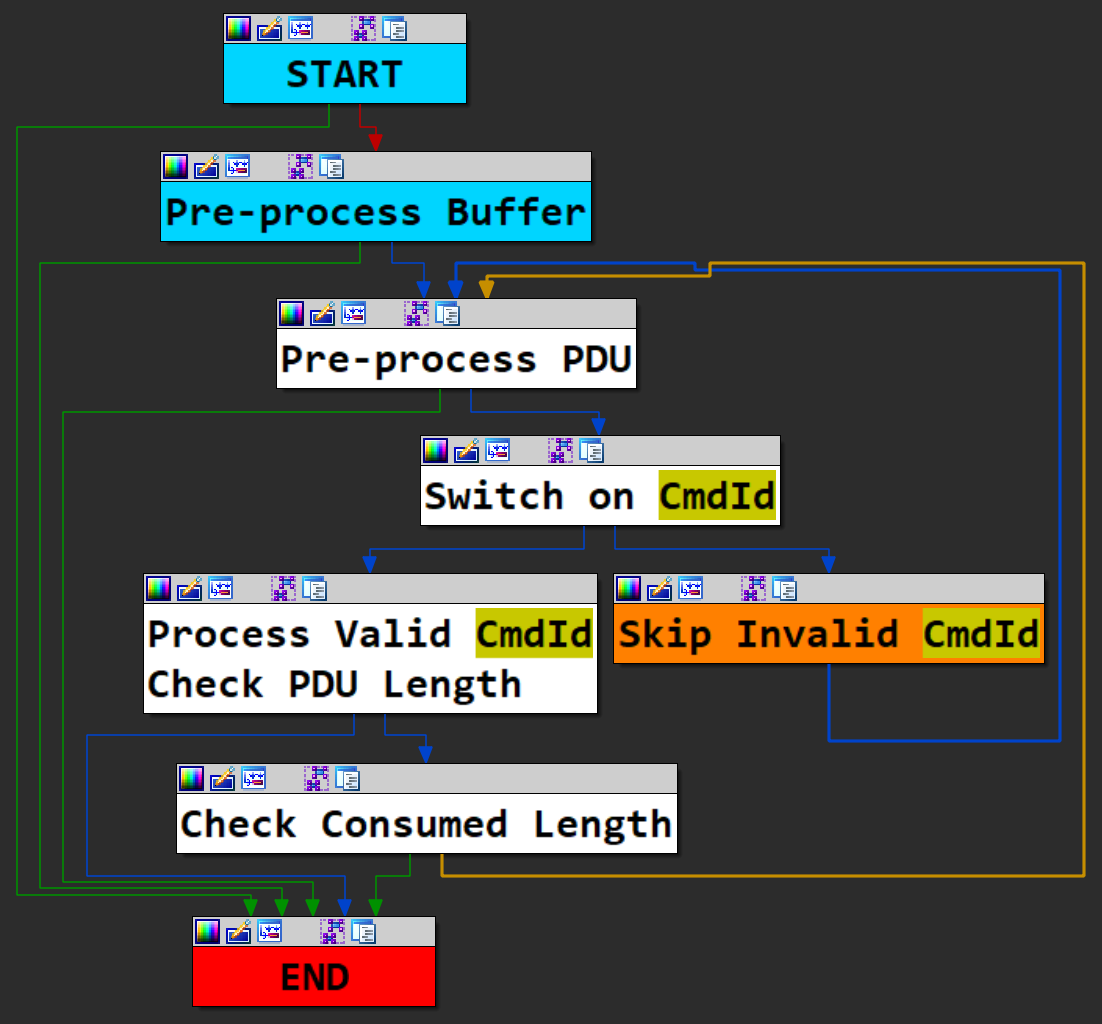
In order to simplify this CFG, we assigned colors to basic blocks and grouped them together. We want to fuzz the basic blocks in white, where the received message is processed. We can clearly see a dispatcher with twenty options. Abstracting away most of the code we get this much simpler high level view:
First, in blue, the function preamble and some pre-processing of the received buffer (decompressing in particular);
then a loop (in white and orange) in which each command (or PDU) in the buffer is processed individually:
- some pre-processing and basic checks
- a switch on
cmdId, an invalid PDU is just skipped using itspduLength - the corresponding handler is called: before processing the PDU its
pduLengthis checked against a minimal value, after processing and if no error occurred the consumed length is returned - the consumed length is then checked against the
pduLengthdeclared in the header, if they differ an error is reported
the loop continues until an error occurs or all PDUs are processed
every exit conditions are collapsed in a single red node
We’ll thus start fuzzing at the end of the buffer pre-processing phase, just before the start of the loop, and stop on any red block.
As already explained in the previous section we needed several attempts before getting a satisfactory snapshot. Similarly our initial harness needed a few iterations.
First, we got issues with logging: with no I/O available our fuzzer would crash. We decided to stop fuzzing whenever an error was logged:
  g_Backend->SetBreakpoint("mstscax!RdpGfxProtocolClientDecoder::LogError",
                           [](Backend_t* Backend) {
                             DebugPrint("LogError!\n");
                             Backend->Stop(Ok_t());
                           });
Similarly we deactivated event tracing:
  //
  // Overwrite mstscax!WPP_GLOBAL_Control to deactivate event tracing
  //
  const uint64_t pWPP_GLOBAL_Control =
      g_Dbg.GetSymbol("mstscax!WPP_GLOBAL_Control");
  g_Backend->VirtWriteStruct(Gva_t(pWPP_GLOBAL_Control),
                             &pWPP_GLOBAL_Control);
We also had to hook __imp_QueryPerformanceCounter:
  //
  // Emulate __imp_QueryPerformanceCounter
  //
  g_Backend->SetBreakpoint(
      "KERNEL32!QueryPerformanceCounterStub",
      [](Backend_t* Backend) {
        //
        // Set PerformanceCount.
        //
        const uint64_t lpPerformanceCount = Backend->Rcx();
        g_query_perf_count++;
        Backend->VirtWriteStructDirty(Gva_t(lpPerformanceCount),
                                      &g_query_perf_count);

        //
        // Return 1.
        //
        Backend->SimulateReturnFromFunction(1);
      }
  );
At that point wtf was fuzzing smoothly. We did not get any crashes though, even after injecting intentionally faulty code in our target…
It turned out we forgot to call SetupUsermodeCrashDetectionHooks,
the function provided by wtf to setup, as the name suggests, crash detection 🤦.
After feeling dumb for a while and fixing this rookie mistake we still had no crashes.
Harder, Better, Faster, Stronger
After a day or so our campaign would saturate.
We tried quite a few things to improve our coverage, which is only an imperfect proxy for the ability of a fuzzer to find bugs.
Just restarting the campaign from the initial corpus, or re-using the output corpus as inputs, would be enough sometimes to leave the previous plateau.
We also varied the max_len and limit parameters of wtf.
max_len is a required parameter that limits the size of the generated samples.
Setting it too small will make some parts of the target unreachable, setting it too big will make it difficult for the mutator to mutate the right bytes. We ran several campaigns with various values for max_len, mixing the resulting corpora together.
limit is an optional parameter that limits the length of executions. Again, setting it too small will make some parts of the target unreachable. Not setting it, or setting it too big, might result in a drop in the number of executions per seconds. Indeed, execution time for samples generated by mutation of a test case from the corpus are often similar; it is thus sometimes preferable to prevent a long running sample from reaching the corpus.
The worst case would be to lock a fuzzer in an infinite loop.
We usually ran campaign with either no limit or one that would result in roughly 5% of timeouts.
While waiting for our fuzzers, we also implemented some more RDPEGFX specific ideas:
- improving our harness;
- tweaking coverage;
- and kneading the corpus.
After presenting those modifications to our fuzzing campaigns, we’ll report the results of an evaluation of some of them.
Improving our Harness
RDPEGFX has a precise grammar documented through Microsoft open specification program. Our initial fuzzing campaigns generated a lot of invalid PDUs. There are three classical ways to overcome this problem:
- implement a custom mutator based on the grammar;
- modify the target to skip skippable sanity checks;
- discard or attempt to fix a priori invalid samples.
Not wanting to go through the specification, we went with the last two approaches and focused on the common header part of the PDUs: cmdId and pduLength.
We were lucky enough that our target behaved predictably with respect to those parameters, which allowed us to fix samples on the fly. Remember that our samples are composed of several commands (or PDUs) that are processed in a loop composed of:
- some pre-processing and basic checks
- a switch on
cmdId, an invalid PDU is just skipped using itspduLength - the corresponding handler is called: before processing the PDU its
pduLengthis checked against a minimal value, after processing and if no error occurred the consumed length is returned - the consumed length is then checked against the
pduLengthdeclared in the header, if they differ an error is reported
cmdId are read only once just before the dispatcher. We can thus safely modify the cmdId of each PDU composing the sample under execution with the following callback triggered at the beginning of each iteration:
    // Fix message type
    uint16_t cmdId = Backend->VirtRead4(Gva_t(pPduStart)) & 0xFFFF;
    cmdId = g_fix_cmdId[cmdId % std::size(g_fix_cmdId)];
    Backend->VirtWriteStruct(Gva_t(pPduStart), &cmdId);
Basically we replace cmdId with the corresponding entry in a circular array of valid values.
Instead of looking at the specification we determined the valid values directly from the code of RdpGfxProtocolClientDecoder::Decode, which allowed us to identify the undocumented RDPGFX_DIAGNOSTIC_PDU:
const uint16_t g_fix_cmdId[] = {
    24,  // 0x18 RDPGFX_MAP_SURFACE_TO_SCALED_WINDOW_PDU
    1,   // 0x01 RDPGFX_WIRE_TO_SURFACE_PDU_1
    2,   // 0x02 RDPGFX_WIRE_TO_SURFACE_PDU_2
    3,   // 0x03 RDPGFX_DELETE_ENCODING_CONTEXT_PDU
    4,   // 0x04 RDPGFX_SOLIDFILL_PDU
    5,   // 0x05 RDPGFX_SURFACE_TO_SURFACE_PDU
    6,   // 0x06 RDPGFX_SURFACE_TO_CACHE_PDU
    7,   // 0x07 RDPGFX_CACHE_TO_SURFACE_PDU
    8,   // 0x08 RDPGFX_EVICT_CACHE_ENTRY_PDU
    9,   // 0x09 RDPGFX_CREATE_SURFACE_PDU
    10,  // 0x0a RDPGFX_DELETE_SURFACE_PDU
    11,  // 0x0b RDPGFX_START_FRAME_PDU
    12,  // 0x0c RDPGFX_END_FRAME_PDU
    12,  // 0x0d RDPGFX_FRAME_ACKNOWLEDGE_PDU -> default -> redirect
    14,  // 0x0e RDPGFX_RESET_GRAPHICS_PDU
    15,  // 0x0f RDPGFX_MAP_SURFACE_TO_OUTPUTS_PDU
    15,  // 0x10 RDPGFX_CACHE_IMPORT_OFFER_PDU -> default -> redirect
    17,  // 0x11 RDPGFX_CACHE_IMPORT_REPLY_PDU
    17,  // 0x12 RDPGFX_CAPS_ADVERTISE_PDU -> default -> redirect
    19,  // 0x13 RDPGFX_CAPS_CONFIRM_PDU
    20,  // 0x14 UNDOCUMENTED -> RDPGFX_DIAGNOSTIC_PDU
    21,  // 0x15 RDPGFX_MAP_SURFACE_TO_WINDOW_PDU
    21,  // 0x16 RDPGFX_QOE_FRAME_ACKNOWLEDGE_PDU -> default -> redirect
    23,  // 0x17 RDPGFX_MAP_SURFACE_TO_SCALED_OUTPUT_PDU
};
You’ll remark that some values appear twice, and might thus be over-represented in fixed PDUs. Some PDUs are indeed only sent and not processed by the client, in order to avoid them we just replaced them with the preceding cmdId as we wanted valid samples not to change and keep the code simple.
As a side note, we can easily use this table to target a specific subset of all valid commands.
Most PDUs have a variable length. The value of pduLength is checked twice (actually thrice as we will discuss later). First, in the PDU loop body, to check if there is enough data in the received buffer, then in the PDU handlers to check that pduLength is bigger than the minimal length. Again we retrieved those minimal length from the code, more precisely from the preamble of each handler:
const uint32_t g_min_body_size[] = {
    0,      // 0x18 Invalid msg type
    0x11,   // 0x01 RDPGFX_WIRE_TO_SURFACE_PDU_1
    0xd,    // 0x02 RDPGFX_WIRE_TO_SURFACE_PDU_2
    0x6,    // 0x03 RDPGFX_DELETE_ENCODING_CONTEXT_PDU
    0x8,    // 0x04 RDPGFX_SOLIDFILL_PDU
    0xe,    // 0x05 RDPGFX_SURFACE_TO_SURFACE_PDU
    0x14,   // 0x06 RDPGFX_SURFACE_TO_CACHE_PDU
    0x6,    // 0x07 RDPGFX_CACHE_TO_SURFACE_PDU
    0x2,    // 0x08 RDPGFX_EVICT_CACHE_ENTRY_PDU
    0x7,    // 0x09 RDPGFX_CREATE_SURFACE_PDU
    0x2,    // 0x0a RDPGFX_DELETE_SURFACE_PDU
    0x8,    // 0x0b RDPGFX_START_FRAME_PDU
    0x4,    // 0x0c RDPGFX_END_FRAME_PDU
    0,      // 0x0d RDPGFX_FRAME_ACKNOWLEDGE_PDU -> default -> 0
    0x14c,  // 0x0e RDPGFX_RESET_GRAPHICS_PDU
    0xc,    // 0x0f RDPGFX_MAP_SURFACE_TO_OUTPUTS_PDU
    0,      // 0x10 RDPGFX_CACHE_IMPORT_OFFER_PDU -> default -> 0
    0x2,    // 0x11 RDPGFX_CACHE_IMPORT_REPLY_PDU
    0,      // 0x12 RDPGFX_CAPS_ADVERTISE_PDU -> default -> 0
    0x8,    // 0x13 RDPGFX_CAPS_CONFIRM_PDU
    0x4,    // 0x14 UNDOCUMENTED -> DiagnosticPDU
    0x12,   // 0x15 RDPGFX_MAP_SURFACE_TO_WINDOW_PDU
    0,      // 0x16 RDPGFX_QOE_FRAME_ACKNOWLEDGE_PDU -> default -> 0
    0x14,   // 0x17 RDPGFX_MAP_SURFACE_TO_SCALED_OUTPUT_PDU
    0x1a,   // 0x18 RDPGFX_MAP_SURFACE_TO_SCALED_WINDOW_PDU
};
Then we ensure in the same callback fixing cmdId that pduLength will pass those two checks:
    // Fix message length
    const uint32_t min_msg_size = 8 + g_min_body_size[msg_type];

    if (min_msg_size > max_msg_size) {
      // not enough data
      Backend->Stop(Ok_t());
      return;
    }

    uint32_t msg_size = Backend->VirtRead4(Gva_t(pBufferStart + 4));
    if (msg_size < min_msg_size) {
      // msg_size too small
      msg_size = min_msg_size;
    } else if (msg_size > max_msg_size) {
      // msg_size too big
      msg_size = max_msg_size;
    }
    Backend->VirtWriteStruct(Gva_t(pBufferStart + 4), &msg_size);
pduLength is actually checked a third time at the end of each loop iteration against the consumed length reported by the handlers. We cannot know that value before processing without parsing the PDU ourselves, instead we just nopped that check:
  // Overwrite jnz with nop in order to skip length check
  const uint64_t pJNZ = g_Dbg.GetSymbol(
    "mstscax!RdpGfxProtocolClientDecoder::Decode+0x1e6"
  );
  const uint8_t NOP[6] = {0x90, 0x90, 0x90, 0x90, 0x90, 0x90};

  g_Backend->VirtWriteStruct(Gva_t(pJNZ), &NOP);
We could already observe a significant improvement in terms of basic blocks covered, but wanted to go further without analyzing individual handlers.
Instead of fixing samples even further we decided to limit the number of PDUs executed.
The reason is the same as for max_len and limit: keeping samples small and executions shorts, but in a way more suitable to our target.
As we already had a callback triggering at the start of each loop iteration we just had to add:
    // Stop if MAX_MSG_COUNT_ALLOWED PDUs were processed
    if (g_msg_count >= MAX_MSG_COUNT_ALLOWED) {
      Backend->Stop(Ok_t());
      return;
    }
    g_msg_count++;
The global g_msg_count needs of course to be reset after every execution, we could have done it in the InsertTestcase function of our harness, instead we did it in the Restore function called at the end of each execution.
We also used that function to dump fixed samples as our output corpus was composed of test cases passed to our harness, not the ones our harness passed to the target.
Tweaking Coverage
wtf uses basic blocks coverage, which is fine, but the industry standard seems to be edge coverage.
We implemented it in the Bochscpu backend in PR#136.
We won’t enter into the details here but we took advantage of a few of the numerous instrumentation points exposed by bochs. Among others, we used bx_instr_cnear_branch_taken which is called every time a conditional near branch is taken as an example.
Context sensitive coverage is also becoming more and more popular.
We had a clear candidate for context here: the cmdId being currently processed. Again we used our callback triggered at the start of every loop iteration to set a new context attribute of the backend to cmdId.
Then when adding a value to AggregatedCodeCoverage_ we just XOR it with context before:
  cover ^= context;
  const auto &Res = AggregatedCodeCoverage_.emplace(cover);
  if (Res.second) {
    LastNewCoverage_.emplace(cover);
  }
As we will see later bochscpu is really slow compared to a virtualization based solution like KVM, up to 100 times slower. Unfortunately adding context sensitive edge coverage to the KVM or whv backends is not as easy as adding it to the bochscpu backend. Both use one time breakpoints to record basic block coverage; edge coverage would require permanent breakpoints. Several parts of the code would need to change and more importantly this would strongly impact performance.
Before delving into more exotic coverage, let us digress about what coverage is for. Obviously coverage is the feedback used by the fuzzer to decide if a new sample should be added to the corpus in order to serve as a seed for the generation of further samples. By deciding what kind of coverage to use, one decides what kind of behavior to observe. The coverage is the abstraction of the precise trace used to guide the fuzzer.
Adding a sample to the corpus effectively locks out of the corpus all potential samples that would result in a behavior already covered by the existing corpus and the added sample. Let us illustrate this concept with the following animation:
Each sample execution is represented by a blue dot; green dots are samples whose execution increased the coverage, or equivalently exhibited a new behavior according to the chosen coverage. White cells represent the set of samples that won’t exhibit a new behavior. Of course this illustration is far from perfect (samples can rarely be represented on a 2D continuous plane, and samples with a similar behavior rarely live in a nice convex set for starter) but it will be enough to convey our point.
At each iteration of the fuzzing loop, a new sample is derived from existing ones. Its execution will either exhibit a new behavior (outside of the current white cells) or not. The set of samples covered by the white cells (which we cannot construct but is implicitly defined) will grow until a crashing sample (in red) is discovered.
If the kind of coverage, or behavior, considered is very precise (like the hash of a full trace), then the cells will be very small and almost every new sample will define a new cell and be added to the corpus. Fuzzing will not really be coverage guided, but rather random.
If instead the kind of behaviors considered is very coarse (like a one bit crash/no-crash distinction), some cells will be very large and almost no sample will define a new cell. Again, fuzzing will not really be guided, but rather random in the neighborhood of the corpus’ samples.
What we are really interested in is actually the crash/no-crash distinction, but as a coverage it is way too coarse to ensure progression from a non-crashing sample to a crashing one.
Going back to basic block coverage and context sensitive edge coverage, the former is coarser than the latter and thus results in larger cells. Being more precise, context sensitive edge coverage will result in a bigger corpus. Deriving new test cases from every sample of the corpus will thus take more and more time. Making the slowness of the bochscpu backend even more critical.
By combining a coarse but fast KVM backend with precise but slow bochscpu backends we may partly overcome this issue. Intuitively the bochscpu backends will add to the corpus some samples that do not visit new basic blocks but are sufficiently different from existing ones. The fuzzer will thus generate more diverse samples that the faster KVM backend might identify as interesting.
This intermediate solution is only interesting because we do not have a fast backend with context sensitive edge coverage. As already discussed we chose not to implement it. Instead, we thought about what other kind of behavior we could monitor efficiently. As most snapshot fuzzers, wtf records the set of dirty pages in order to be able to restore the original snapshot. We used this available behavioral data as a feedback for some of our fuzzing campaigns.
It drastically changed the kind of samples the fuzzer was optimizing for and had the side effect of favoring numerous and large allocations which usually results in longer execution time.
That’s the only weird experiment we did with KVM, but the flexibility of bochscpu allowed us to explore other kinds of exotic coverage. We’ll present two of them: imul coverage and time sensitive coverage.
The intent behind imul coverage is to look for (spoiler alert) integer overflows.
When encountering an integer multiplication we evaluate the number of significant bits of the result and add to the coverage a value built by combining the current imul address with that number of bits.
Since we do not want the fuzzer to look for multiplications with a smaller result (we are interested in bigger results) we also add all values corresponding to a smaller number of bits:
for (int i = 0; i < nbr_bits; i++) {
  imul_cover = imul_rip ^ hash(i);
  const auto &Res = AggregatedCodeCoverage_.emplace(imul_cover);
  if (Res.second) {
    LastNewCoverage_.emplace(imul_cover);
  }
}
We have to admit, it did not help us discover any integer overflow.
Time sensitive coverage is a kind of context sensitive coverage where the context is, well, time, or more precisely RunStats_.NumberInstructionsExecuted.
Using this value directly would be way too precise, resulting in an almost random exploration as already discussed.
Instead we defined four ranges: earlier, early, late, later; represented by four different values and used those values as a context.
The intent was to pull the discovered behaviors toward the start of the execution in order to favor, with other techniques, fast executions.
Similarly to imul coverage, once we encounter a behavior early, we are not interested in later occurrences; we thus add to the coverage all values corresponding to later encounters.
Honestly, we have no idea how much our coverage tricks improved our fuzzing campaign, or even if they did, in terms of basic blocks covered or if they helped discover the crash we’ll discuss later. At least, we are pretty sure it helped us increase the diversity of our corpus. In the next section we discuss some corpus manipulation that, we believe, improved our campaigns.
Kneading the Corpus
Wtf never drops a sample from the corpus and does not check if they become redundant during a fuzzing session. Restarting the fuzzer from the obtained corpus triggers a corpus minimization phase that may accelerate coverage improvement: a small corpus means that it is faster to find the right mutation on the right sample.
For corpus minimization, wtf uses a greedy strategy: samples of the corpus are sorted by size and sent to the target, any sample discovering new coverage not already covered by smaller samples is added to the corpus. Again, the idea here is that small samples may lead to a small corpus and easier progress.
This single pass greedy approach does have some limitation: a selected sample might cover the behaviors exhibited by one or several smaller selected samples, making them redundant. We added a second pass in reverse order to remove those redundant samples. The resulting two pass greedy approach is not optimal but at least generates a corpus without redundant samples.
Another strategy we experimented with was just to randomly drop up to half of the corpus before restarting in order to force the fuzzer to rediscover the coverage with different samples and hopefully escape from a plateau, which it did sometimes.
The idea behinds those corpus manipulation is to try to shake things up in order to leave the plateau when a fuzzer gets stuck. They are independent of the target, we also applied transformations related to the structure of RDPEGFX messages.
Thanks to our improved harness we are able to dump messages composed entirely of PDUs with a valid header. This header is enough to split messages into their individual PDUs. We thus implemented a simple parser that would split and recombine messages.
Evaluation
We tried many things, alternating between different approaches, getting a bigger and bigger aggregated corpus, and we ultimately found a bug. Knowing which modifications in our code or process were decisive is very hard, almost impossible.
After being accepted at HexaCon we tried to evaluate some of our changes.
We decided to run various fuzzing campaigns starting from the same corpus and running under similar conditions.
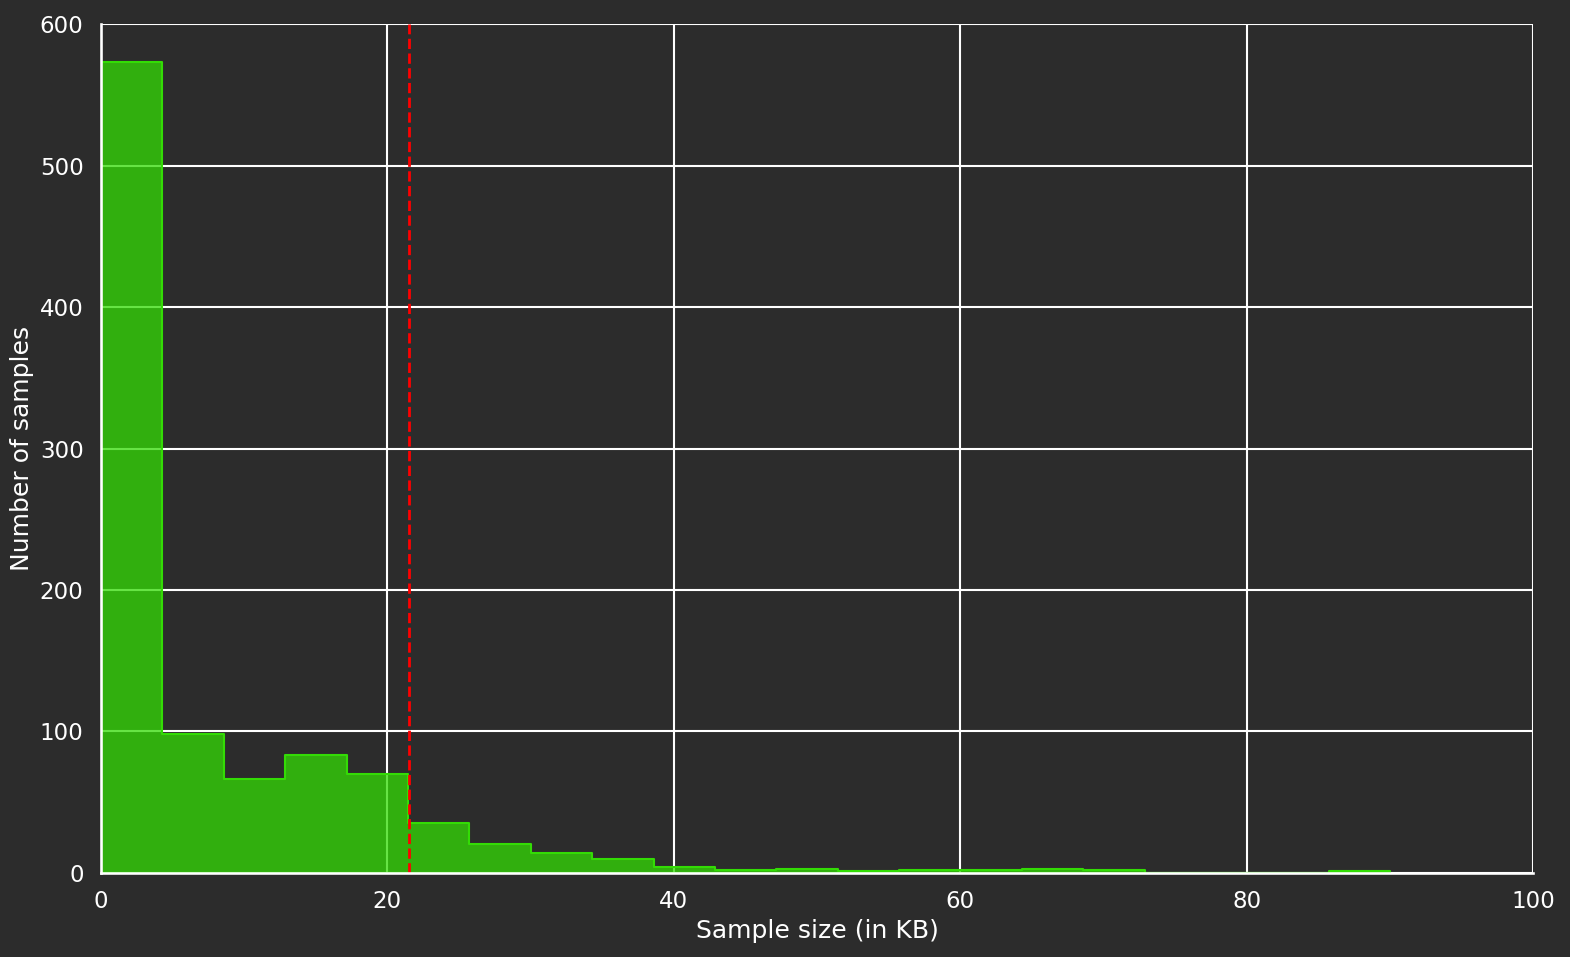
The following histogram shows the distribution of the size of the samples in our initial corpus, the one we got from capturing a live RDP session:
Most of the samples are smaller than 22KB (or 0X5600), so that’s the value we chose for the max_len parameter.
Moreover since we did not encounter any infinite loops, we did not set the limit parameter.
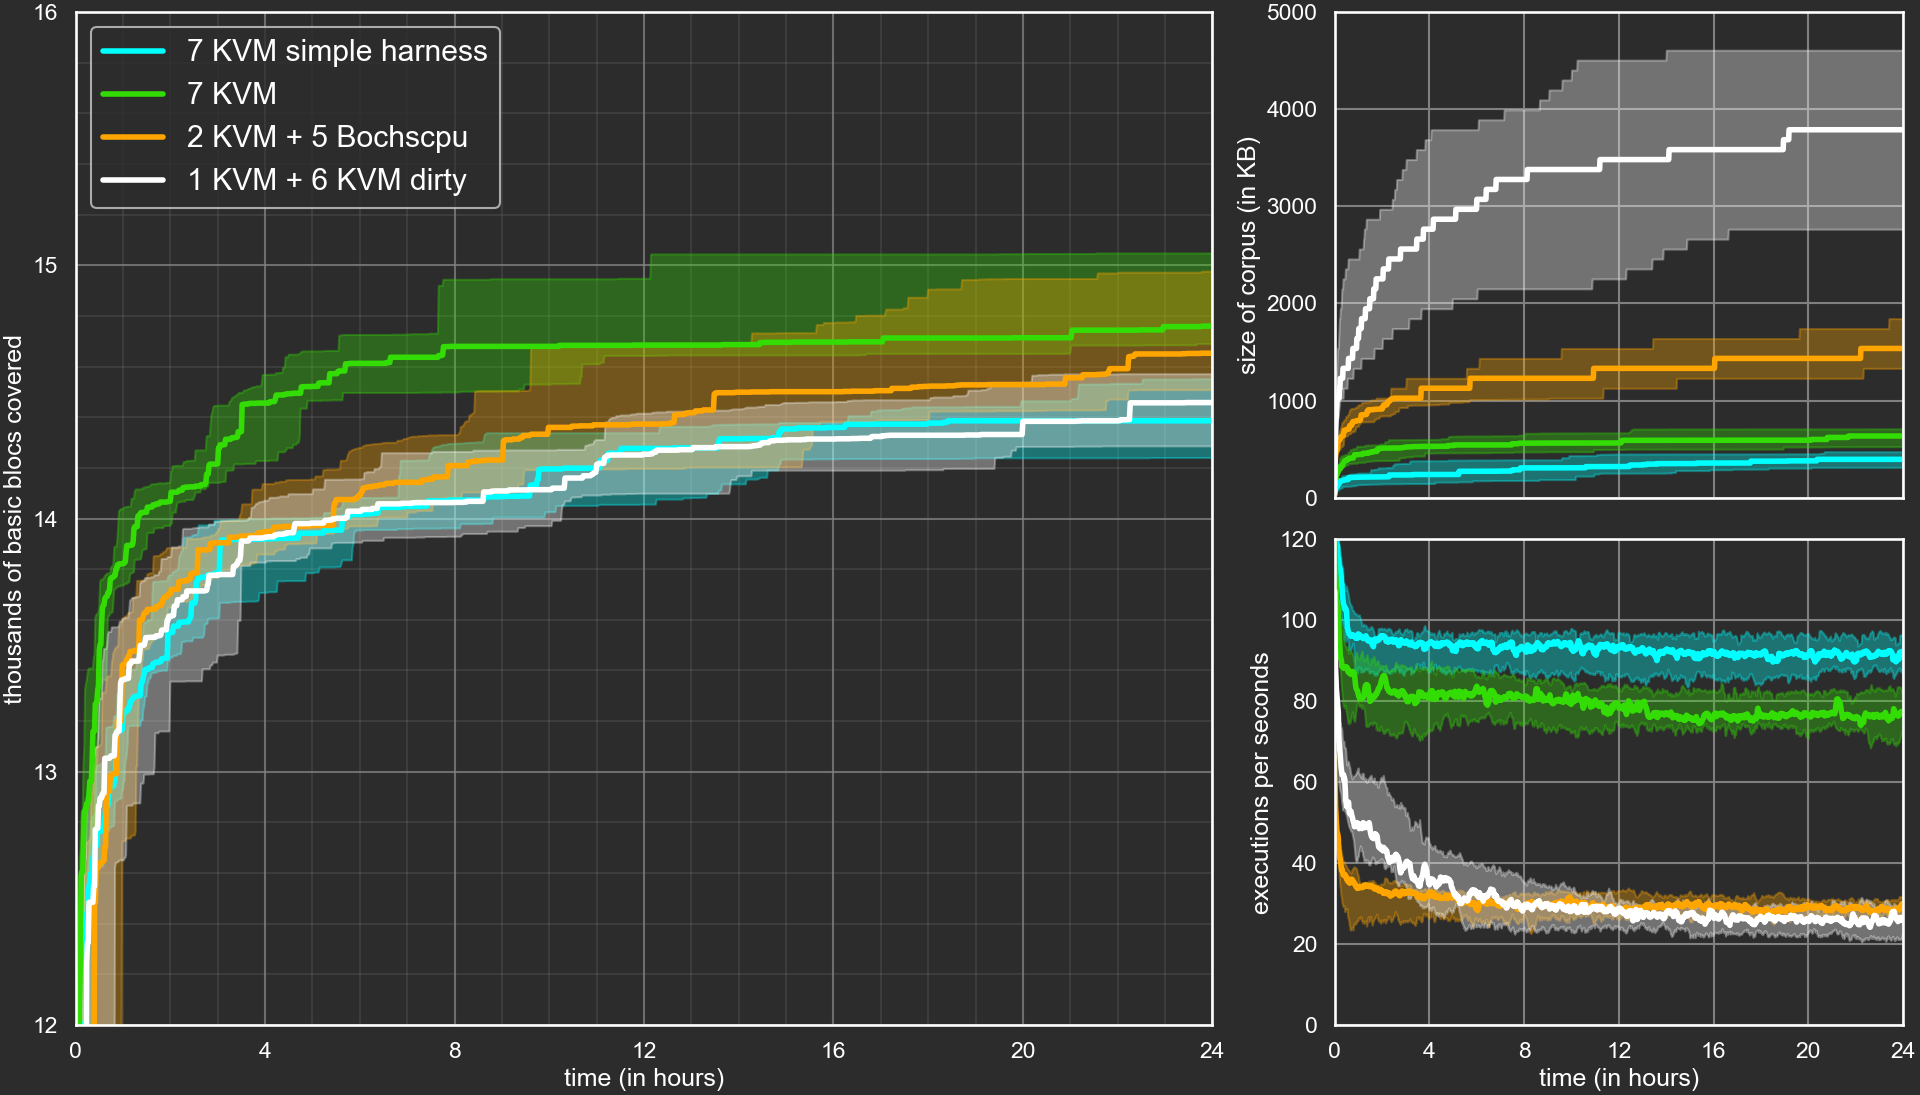
We chose four configuration that we ran 15 times each over a 24h period; they all used one manager and seven worker processes:
- 7 KVM backends with a naïve harness (blue);
- 7 KVM backends with our improved harness (green);
- 2 KVM backends with basic blocks coverage and 5 bochscpu backends with context sensitive edge coverage, all using the improved harness (orange);
- 1 KVM backend with basic blocks coverage and 6 KVM backends with basic blocks and dirty pages coverage, all using the improved harness (orange).
In order to perform comparisons we need a common coverage measurement, that is why the last two configurations include a KVM backend with basic blocks coverage. Moreover, bochscpu is so slow that we decided to replace one slow but precise bochscpu backend with a coarse but fast KVM one.
The results are shown in the following graphs:
Where are the 15 runs per configuration? We felt that the graph was even less readable with 4*15 curves, so for each configuration we built the curve of median values surrounded by a tube containing 60% of the curves. The tube is built by removing, at each time point, the 3 upper and 3 lower values in order to eliminate any lucky, or unlucky, outliers.
The median numbers of basic blocks covered after 24h for the different configurations lie between 14400 and 14800. The difference might not seem like a lot, especially considering that the aggregated corpus of these campaigns and all the previous ones covers slightly more than 17000 basic blocks.
The difference is more notable when considering the time it takes to reach the number of basic blocks covered by the blue curve (naïve harness). It takes between 20h and 22h our for the white curve (dirty coverage), roughly 12 hours for the orange curve (context sensitive edge coverage), and less than four hours for the green one (improved harness).
Some improvement was expected for the green curve as any invalid PDU is fixed and may contribute to new coverage instead of being skipped or discarded. Looking at the number of executions per seconds we can observe that the fuzzer is slower than with a naïve harness. Again this is expected, as the fuzzer executes more code for each sample. The same observation can be made by looking at the size of the corpus: it is bigger in KB but slightly smaller if we count the number of samples in the corpus (not shown in the graph); this is probably because big samples have more chance to cover new basic blocks if all PDUs have a valid header.
The results of the orange campaign are a bit disappointing, all the more considering that it also used the improved harness. In terms of basic blocks covered this is not an improvement to say the least. This can be partly explained by our unusual setup, mixing fuzzers with different kinds of coverage, and the slowness of bochscpu. Looking at the number of executions per seconds, it is almost three times slower than the green campaign and actually most of the executions are performed by the two KVM backends which do not use context sensitive edge coverage.
As for the white campaign… we did not really know what to expect. Still, we are a bit disappointed as it also uses the improved harness. Interestingly enough, after four hours, the seven KVM backends become as slow as the 2 KVM + 5 bochscpu backends of the orange campaign. Since we are optimizing for dirty pages coverage, we can infer that the fuzzer just builds messages with more and more PDUs doing more and more allocations, resulting in very long executions.
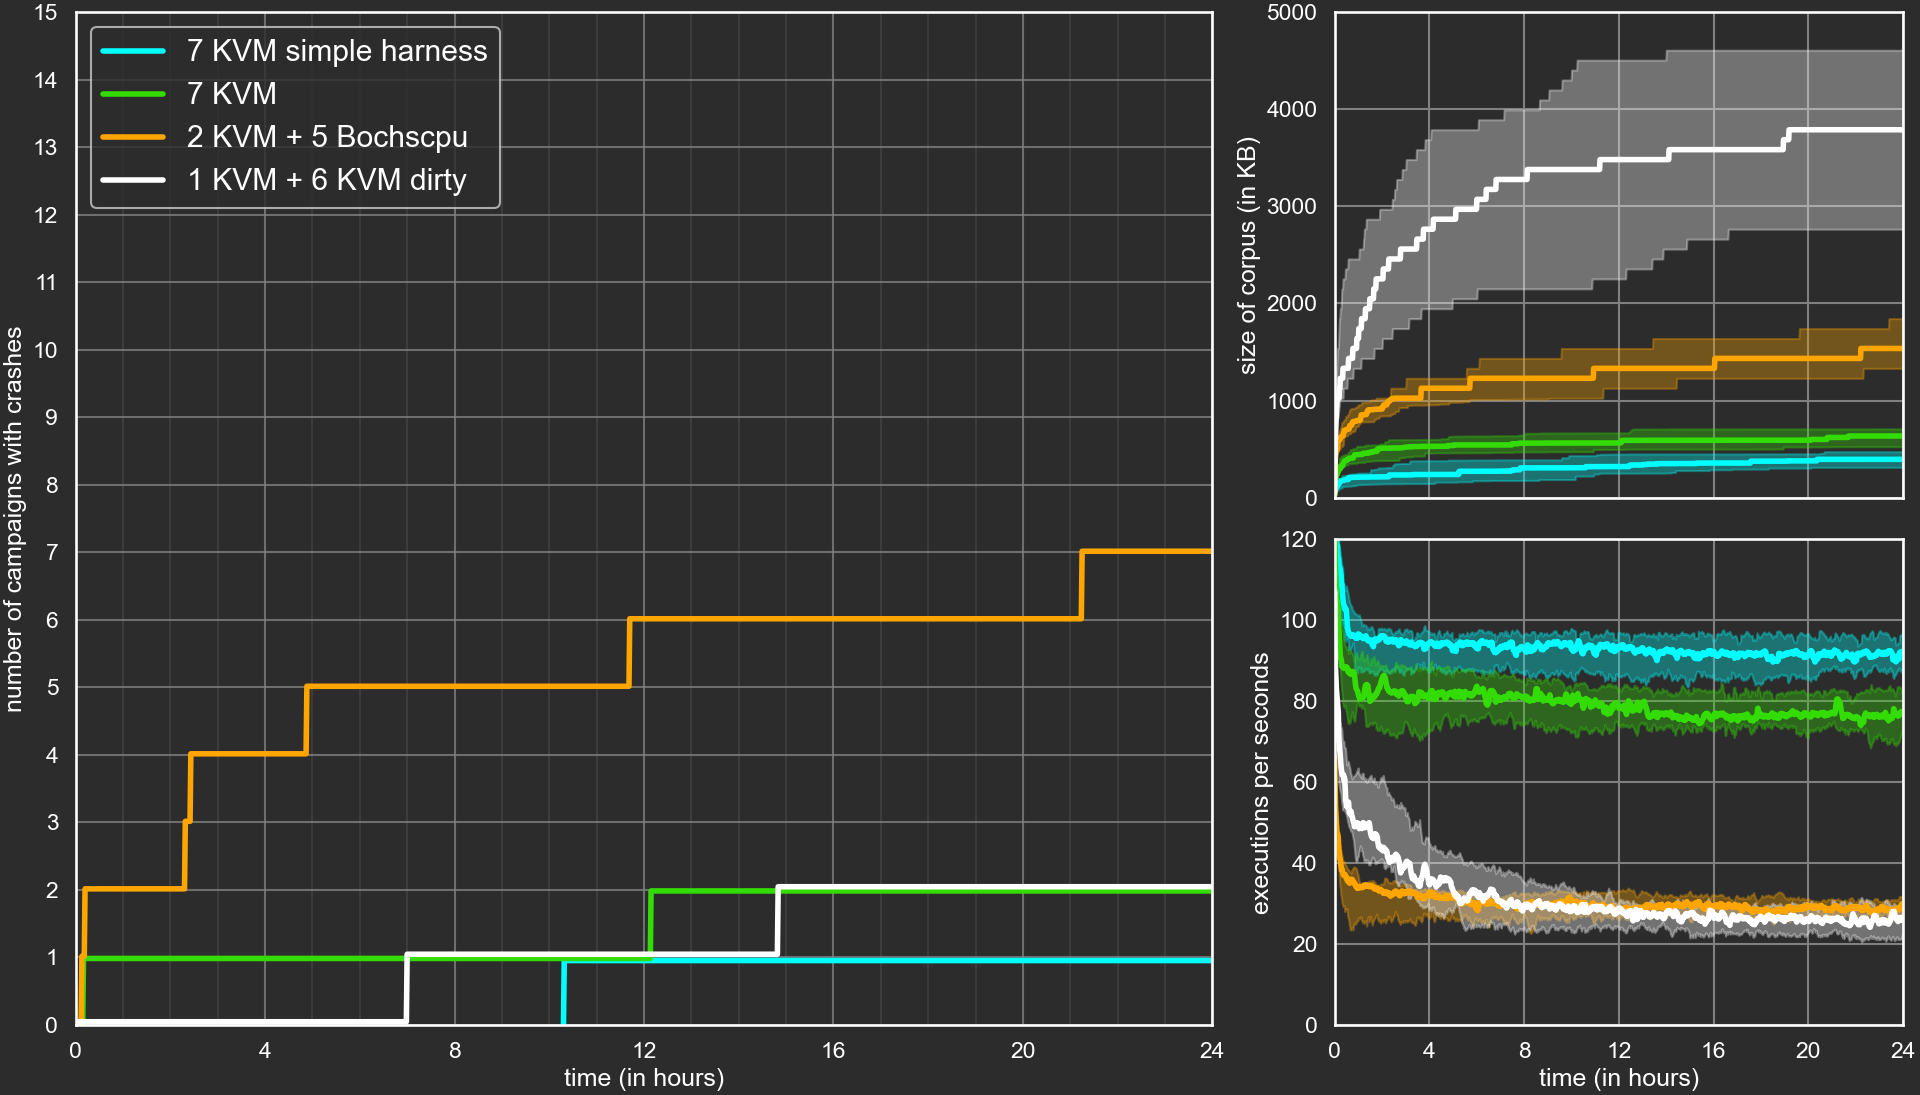
We could argue that looking at basic block coverage is arbitrary and actually favor the green and white campaigns. If we looked at the number of edges covered or pages written to, the orange and white campaign would probably come out on top. In fact what we are really interested in is the number of bugs found. We only found one, so it is hard to do stats on that, but here are the curves of the number of campaigns reporting crashes:
The maximum is 15 since we ran each configuration 15 times. Only one of the 15 blue runs and two of the 15 green and 15 white runs report finding one or more crashes. But almost half of the orange runs found some crashes.
The orange campaign was not so bad in the end. These results should be taken with a grain of salt. First, for basic block and edge coverage we only considered the ones in the module involved in the crash we already found in our initial campaigns. We kind of helped the fuzzer explore in the right direction. Second, and more importantly, we did not properly monitor which campaign reported which crash. We only monitored the crashes properly after observing suspiciously good results for the orange curve. The three campaigns that reported crashes after we started monitoring them properly did find the bug we’ll explain in the next section, we are not sure about the other four but most of them are probably that same bug. Anyway, even if they are not, the orange campaigns were better at finding our bug than the other ones despite being much slower.
Crash Analysis
During our initial campaigns, we got a dozen of crashes (not counting duplicates) but most of them where either linked to an incomplete snapshot or a bug in our modifications to wtf or our aggressively optimized harness.
We were eventually able to get rid of all of them but one: crash-ACCESS_VIOLATION_WRITE-0x7df491561122.
The bug itself is not that interesting and we were not able to exploit it. For a detailed description you can have a look at our MSRC report. Instead we’ll recount here how we analyzed it (or rather, how we should have analyzed it in retrospect).
Even though it consistently lead to a crash under the bochscpu and KVM backends we were confronted to three difficulties:
- we were not able reproduce it on a live system;
- there was nothing in the dump at the address the crash was reported to occur;
- analysis was further made difficult by the fact that the resulting trace weighed several dozens of gigabytes.
We’ll work these issues in reverse order.
Reducing the trace size
Thanks to Microsoft’s documentation we were able to identify the PDUs the crashing buffer was composed of:
CREATE_SURFACE_PDUCREATE_SURFACE_PDUSOLIDFILL_PDUSURFACE_TO_CACHE_PDU
By removing spurious PDUs, we minimized it to:
CREATE_SURFACE_PDU- width: 0x8180
- height: 0x4b0
SOLIDFILL_PDU- left: 0x80
- right: 0x901
- top: 0x25
- bottom: 0xff00
Looking at the parameters the minimized sample was consistent with an out-of-bound write:
We had a better understanding of the crash but still could not analyze it properly, as the resulting trace was still huge.
Indeed, as we realized later, the full surface (CREATE_SURFACE_PDU) and rectangle (SOLIDFILL_PDU) are allocated and filled, for a combined size of more than 727MB.
The rectangle is then copied onto the surface, combining values according to color transparency. All of that represents quite a few operations.
In a more general case we would have put in place a fuzzing campaign keeping only crashing samples and minimizing the number of instructions executed. Here a simple dichotomic search was enough to get a more reasonable trace resulting in a symbolized trace of 218MB, overcoming one of our initial difficulties that would unlock the other two:
CREATE_SURFACE_PDU- width: 0x8100
- height: 0x400
SOLIDFILL_PDU- left: 0x0
- right: 0x1
- top: 0x0
- bottom: 0x7f02
- fillPixel: 0xBADC0DE
Finding the faulting code
The last user space symbol not in ntdll (found with a regex search for ^[^n]) was:
d3d10warp!JITCopyContext::ExecuteResourceCopy+0x6f.
We got the explanation why the faulting code was not in the initial dump: it was jitted code.
In order to retrieve the jitted code we used a tenet trace generated with:
./wtf run --name rdpegfx --state state --backend=bochscpu --input crashes\crash-ACCESS_VIOLATION_WRITE-0x7df491561122 --trace-type=tenet
Going to the last execution of JITCopyContext::ExecuteResourceCopy+0x6f we identified the address of the jitted code.
As tenet records memory writes (and reads), we were able to retrieve the binary code, copy it in a new segment in IDA, and get the assembly code, with tenet support as a bonus.
Reproduction on a live system
So we got the jitted code where the access violation write occurred,
but we still do not know why this code was generated and executed.
Before answering this question, let’s take a look at d3d10warp.
According to Microsoft’s documentation warp stands for Windows Advanced Rasterization Platform. It’s a software rasterizer delivered as part of Direct3D 11 and up and available since windows 7.
It enables Direct3D rendering when Direct3D hardware is not available. That’s why we were not able to reproduce the crash on a live system. Our live system had a graphic card and used it, instead of warp, for rendering.
After deactivating our graphic card by downgrading our video driver to Microsoft Basic Display Adapter we were finally able to reproduce the crash. Another way to deactivate hardware acceleration specific to virtual machines is to ensure that “Enable 3D Acceleration” or “Accelerate 3D graphics” is unchecked in the virtual machine settings.
Root cause analysis
Thanks to our trace length minimization process by dichotomic search we had two almost identical samples, one resulting in an out of bound write and another one terminating gracefully. The only difference was the bottom coordinate of the SOLIDFILL_PDU: 0x7f02 for the crashing sample and 0x7f01 for the other one.
By comparing their respective symbolized traces we were able to identify the point where they diverged: d3d10warp!UMContext::CopyImmediateData+0x2f4.
The crashing trace goes on with UMContext::CopyImmediateData and the non-crashing one soon switches to WarpPlatform::RecordError.
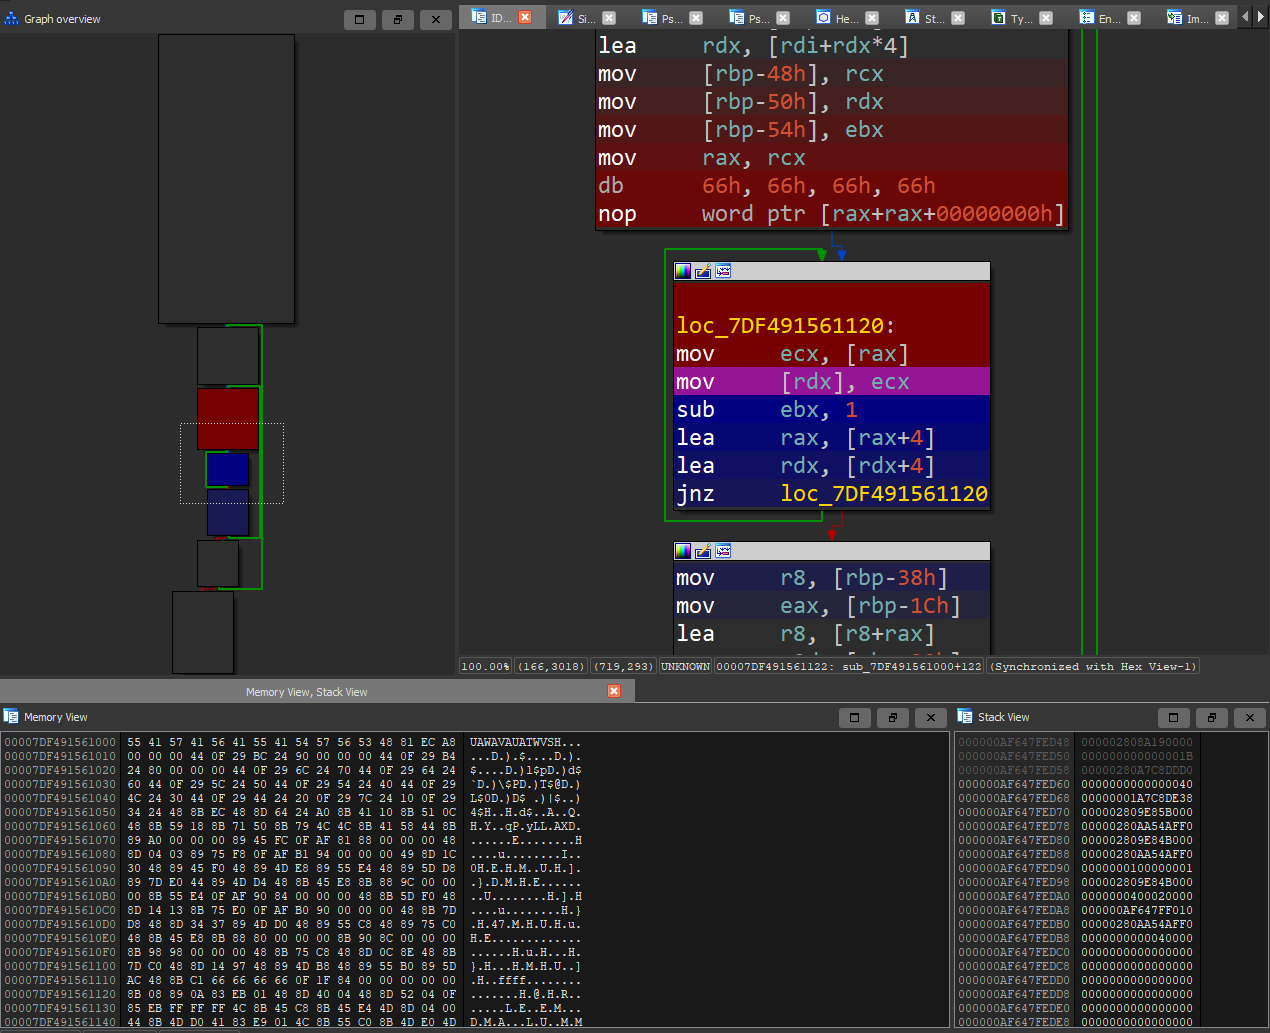
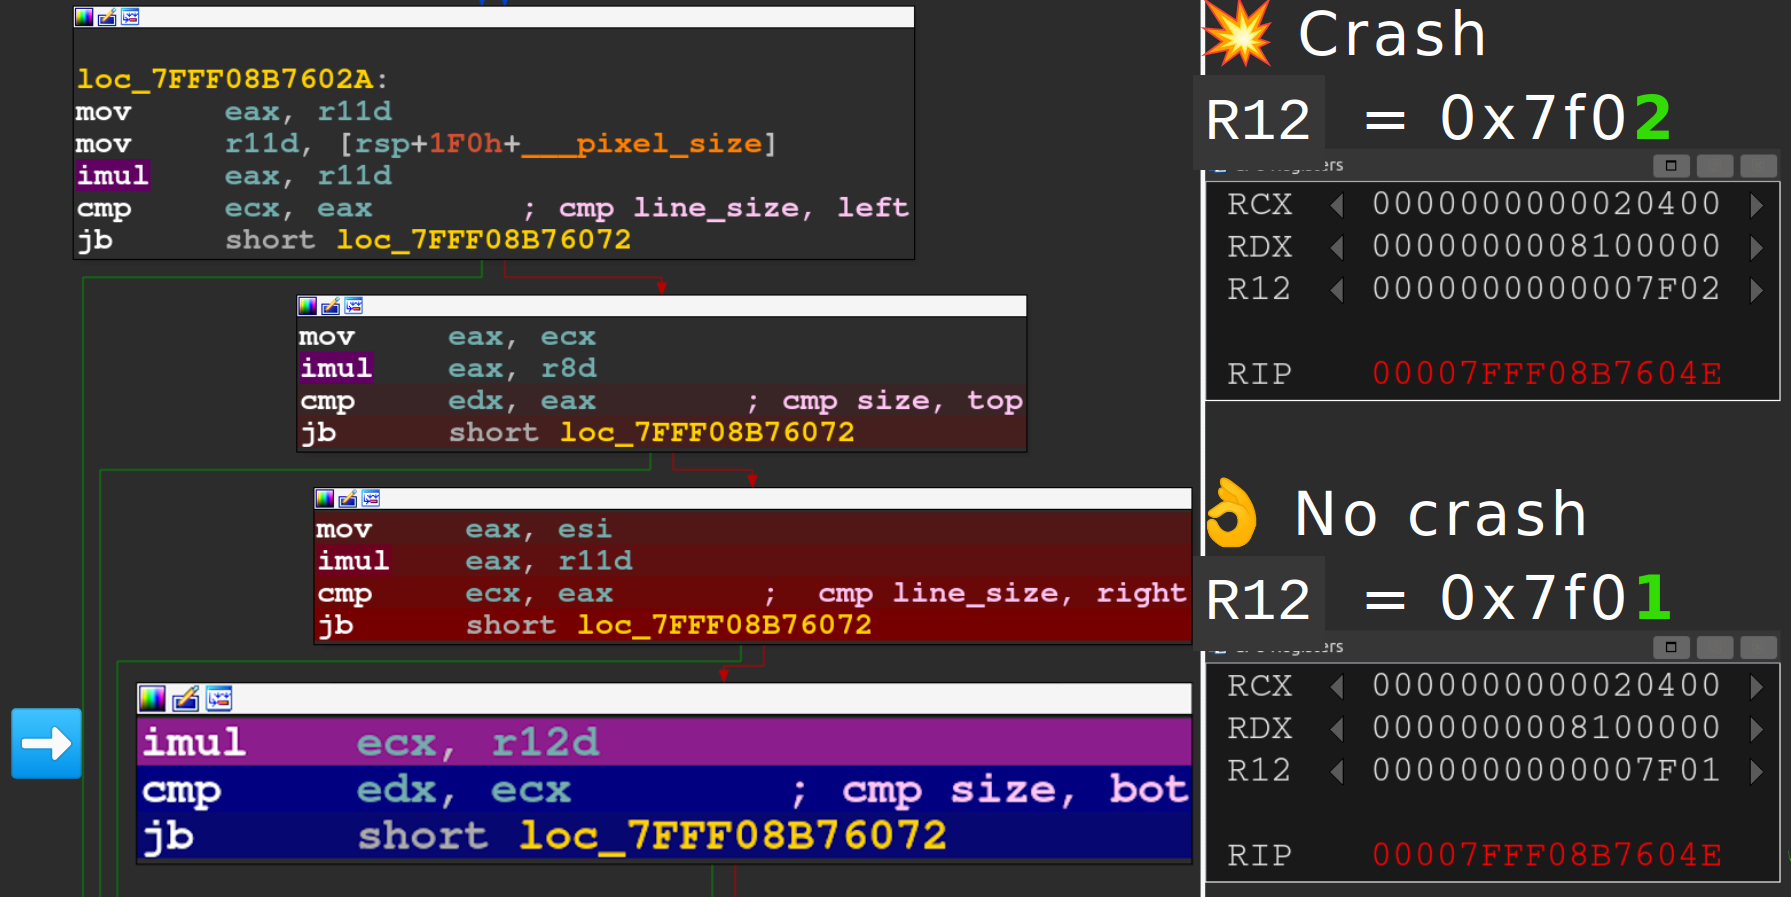
Loading both tenet traces in two instances of IDA and jumping to the last execution of d3d10warp!UMContext::CopyImmediateData+0x2f4 we can observe various checks:
Offset 0x2f4 is the last jump. The crashing trace skips the jump and the non-crashing one takes it. At the start of the block, before the multiplication:
ecxis the total number of bytes in one line of the target surface:width*4(1 for each of R, G, and B; plus 1 for transparency);edxis the total number of bytes of the target surface:width*height*4;- and
r12dis our bottom coordinate: 0x7f02 in the crashing sample, 0x7f01 in the non-crashing sample.
The multiplication is performed on 32 bits and overflows in the crashing trace:
2 0400 * 7f02 = 1 0000 0800
In the end, there is no bug in Microsoft’s RDP client, or even an improper use of direct3D API. The crash is due to an integer overflow in the bound check performed by d3d10warp.
To recap, we had a sample generating a trace of dozens of gigabytes, ending in an unvalidated crash, in code not in our initial dump; and we were able to identify an integer overflow in d3d10warp as the root cause of the crash by:
- reading RDPEGFX specification;
- minimizing the generated trace length by dichotomic search;
- pinpointing the error by diffing the crash and no-crash traces;
- and analyzing it by comparing both tenet traces.
Impact
In our RDP context, the out of bounds write occurs when the following two PDUs are received by the client:
CREATE_SURFACE_PDU- width, height
SOLIDFILL_PDU- left, right, top, bottom
- fillPixel
while width*bottom*4 overflows, among other constraints.
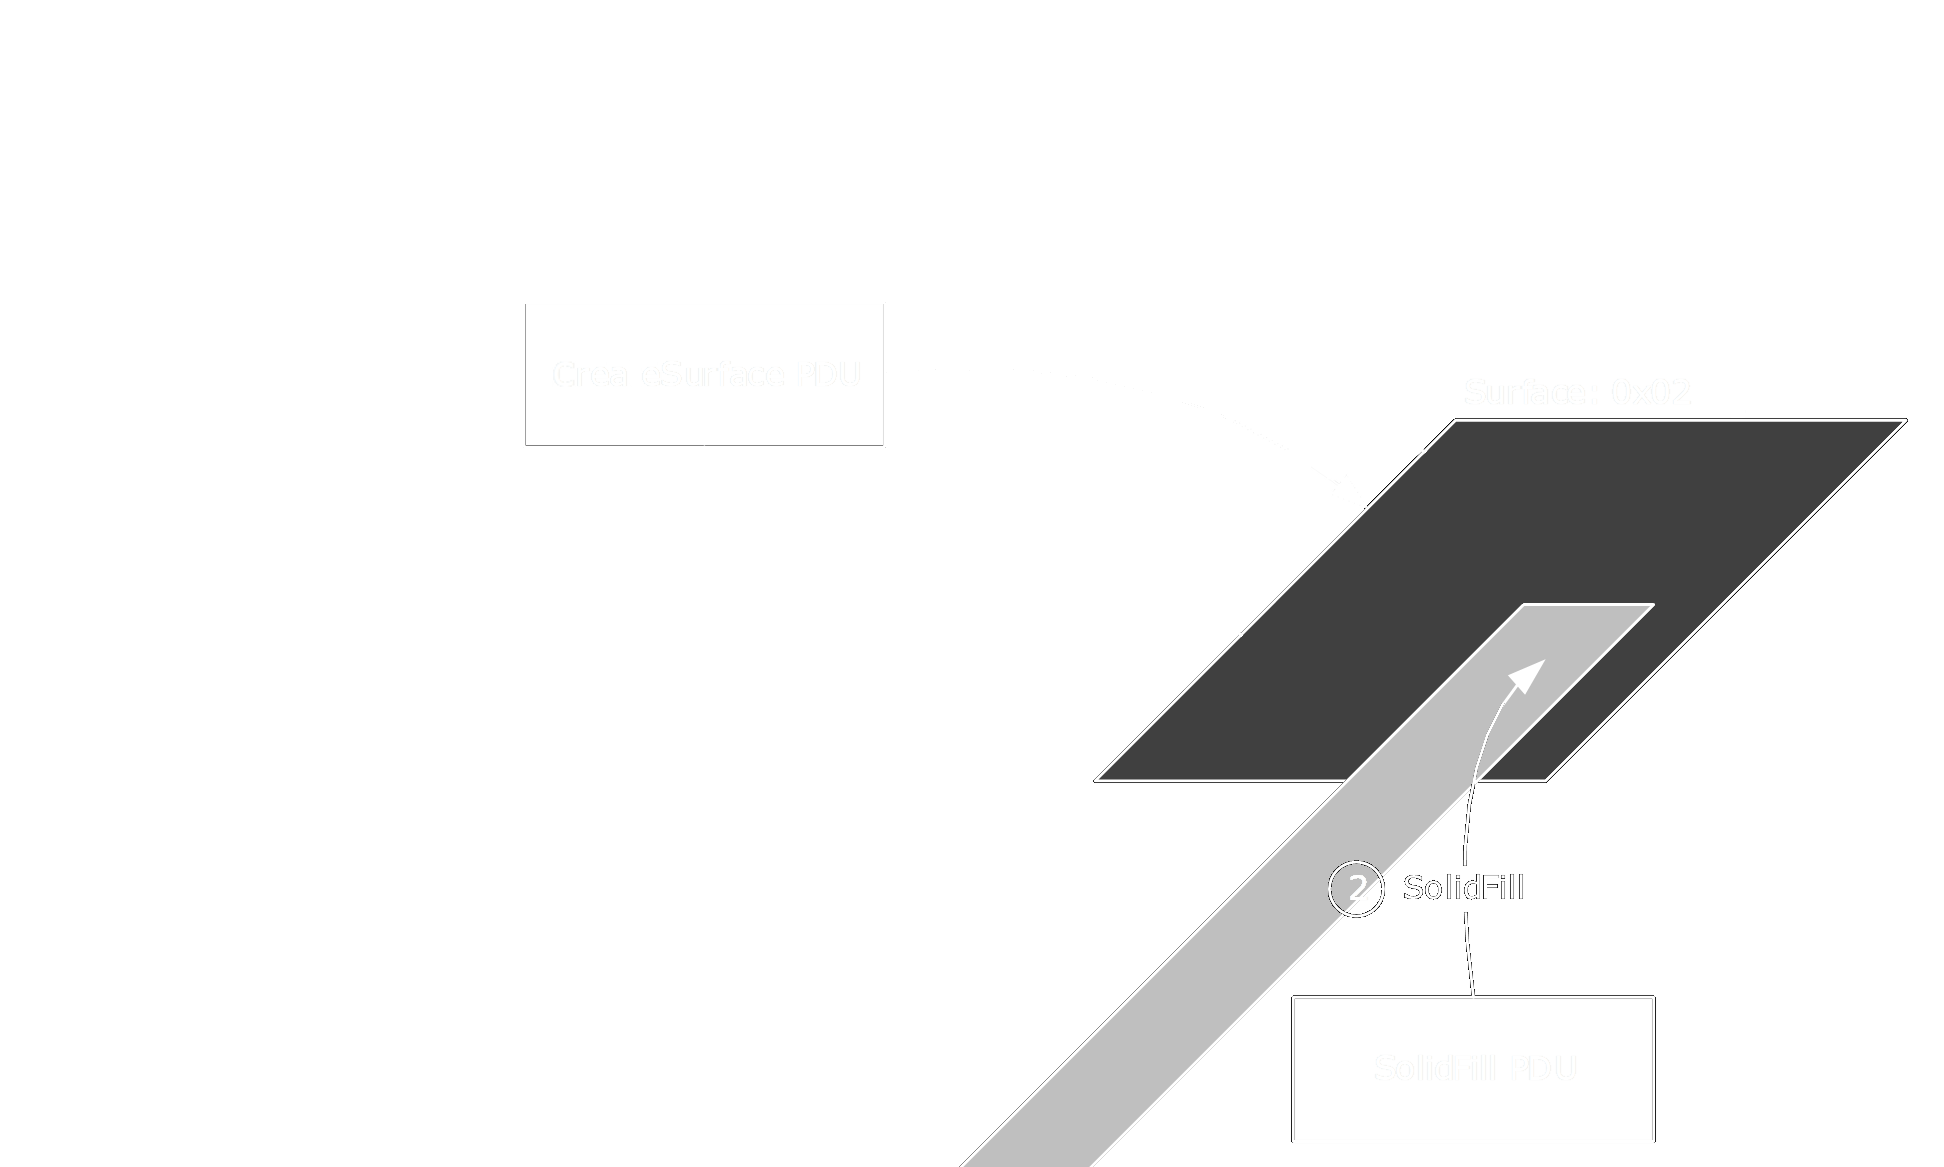
With the notations of the following figure, this allows us to write (X) in the memory defined by SOLIDFILL_PDU (left, right, top, bottom) partly out of the memory (.) defined by CREATE_SURFACE_PDU (width, height):
| 0 | - | - | - | l | - | - | r | - | - | - | - | w | |
|---|---|---|---|---|---|---|---|---|---|---|---|---|---|
| 0 | . | . | . | . | . | . | . | . | . | . | . | . | |
| | | . | . | . | . | . | . | . | . | . | . | . | . | |
| | | . | . | . | . | . | . | . | . | . | . | . | . | |
| | | . | . | . | . | . | . | . | . | . | . | . | . | |
| t | . | . | . | . | X | X | X | . | . | . | . | . | |
| | | . | . | . | . | X | X | X | . | . | . | . | . | |
| | | . | . | . | . | X | X | X | . | . | . | . | . | |
| h | X | X | X | ||||||||||
| - | X | X | X | ||||||||||
| - | X | X | X | ||||||||||
| - | X | X | X | ||||||||||
| - | X | X | X | ||||||||||
| b |
We have an almost arbitrary remote write, which is pretty cool, except for the “almost” part:
- we only control 3 of the 4 bytes written, the transparency byte of the
fillPixelARGB value is replaced with 0xFF; width*bottom*4must be over2^32(otherwise there won’t be an integer overflow), thus the last write is 4GB after the start of the surface;bottom, like other dimensions, is a 16 bits integer. For the overflow to occurwidthmust be bigger than2^14. Since we are writing our value line by line, those write operations occur periodically at least once every 65KB to 256KB.
We can limit the number of writes to a single one if the surface buffer is almost 4GB. In our limited experiments, we could only overflow to other surfaces.
The impact is further limited by the fact that the bug only occurs if d3d10warp.dll is used, when there are no 3D hardware acceleration as an example.
On the other hand, as d3d10warp.dll is loaded by almost all processes when there is no hardware acceleration: browsers, editors, viewers…
the bug might be triggerable in other contexts.
Hunting for similar bugs
As can be seen in the previous tenet figure all parameters of SOLIDFILL_PDU, left, right, top, and bottom are treated similarly. We cannot get an integer overflow for left and right in our RDP context as we can only pass 16 bits, but we can get one for top and bypass its bound check.
By bypassing bound checks for both top and bottom we can hope to get rid of the periodic writes and enforce a single out of bound write. But this is not how it works. The jitted code performs the same integer overflow when calculating the first address to write and then iterate bottom - top times.
The part of SOLIDFILL_PDU defining the rectangle to fill is actually a RDPGFX_RECT16 structure. We looked at other PDU manipulating this structure or the width and height parameters but the ones we looked at properly checked their bounds.
Responsible Disclosure
We sent the report already mentioned earlier to MSRC mid-march together with a PoC and a few tenet traces.
To be clear our PoC is just a trigger, not an exploit. Our PoC is composed of a FreeRDP patch, a Dockerfile, and a Makefile to build and invoke the container with the right parameters.
The Dockerfile builds and exposes a patched FreeRDP server.
The patch is rather simple
and just appends our payload to every messages sent through the GFX channel in the function
rdpgfx_server_packet_send:
--- a/channels/rdpgfx/server/rdpgfx_main.c
+++ b/channels/rdpgfx/server/rdpgfx_main.c
@@ -100,6 +100,38 @@ static UINT rdpgfx_server_packet_send(RdpgfxServerContext* context, wStream* s)
 	BYTE* pSrcData = Stream_Buffer(s);
 	UINT32 SrcSize = Stream_GetPosition(s);
 	wStream* fs;
+	BYTE payload[] = {
+		// RDPGFX_CREATE_SURFACE_PDU
+		0x09, 0x00,             // HEADER.cmdId
+		0x00, 0x00,             // HEADER.flags
+		0x0f, 0x00, 0x00, 0x00, // HEADER.pduLength
+		0x41, 0x41,             // surfaceId
+		0x80, 0x80,             // width
+		0x01, 0x00,             // height
+		0x21,                   // pixelFormat
+		// RDPGFX_SOLID_FILL_PDU
+		0x04, 0x00,             // HEADER.cmdId
+		0x00, 0x00,             // HEADER.flags
+		0x18, 0x00, 0x00, 0x00, // HEADER.pduLength
+		0x41, 0x41,             // surfaceId
+		0x42, 0x42, 0x42, 0x42, // fillPixel
+		0x01, 0x00,             // fillRectCount
+		0x33, 0x33,             // fillRects[0].RECT16.left
+		0x81, 0x7F,             // fillRects[0].RECT16.top
+		0x34, 0x33,             // fillRects[0].RECT16.right
+		0x01, 0xFF              // fillRects[0].RECT16.bottom
+	};
+	BYTE* pAltData = NULL;
+
+	pAltData = malloc(SrcSize + sizeof(payload));
+	memcpy(pAltData, pSrcData, SrcSize);
+	memcpy(pAltData + SrcSize, payload, sizeof(payload));
+
+	pSrcData = pAltData;
+	SrcSize += sizeof(payload);
+
+	printf("Payload appended to legitimate message\n");
+
 	/* Allocate new stream with enough capacity. Additional overhead is
 	 * descriptor (1 bytes) + segmentCount (2 bytes) + uncompressedSize (4 bytes)
 	 * + segmentCount * size (4 bytes) */
@@ -133,10 +165,13 @@ static UINT rdpgfx_server_packet_send(RdpgfxServerContext* context, wStream* s)
 		          Stream_GetPosition(fs));
 	}

+	printf("Payload sent\n");
+
 	error = CHANNEL_RC_OK;
 out:
 	Stream_Free(fs, TRUE);
 	Stream_Free(s, TRUE);
+	free(pAltData);
 	return error;
 }
Connecting to this patched server from Microsoft’s RDP client shipped with the last versions of Windows Insider Preview (as of time of submission) led to a crash of the application.
We did not get much news for almost a month but then we got a few exchanges with our case manager. They reviewed our HexaCon submission and eventually awarded us with a $5000 bounty just before releasing a patch early July.
Conclusion
Thanks to whatthefuzz we were able to get up and fuzzing relatively easily on Microsoft RDP client. The hardest part was to get a suitable initial snapshot. The flexibility of wtf allowed us to try several modifications on our fuzzing campaigns. The most successful one was the classical approach of skipping some checks and fixing some values in the test buffer. The structure of our target, looping over every PDUs, never looking back, allowed us to apply those fixes on the fly on all PDUs headers.
Alternating between campaigns using different coverage and restarting from various subsets of our aggregated corpus, we were able to find an out-of-bound write caused by an integer overflow in d3d10warp. Trace minimization, differential analysis, and tenet greatly helped us analyze that crash.
Despite the convoluted attack scenario (a client without 3D hardware acceleration connecting to a malicious RDP server), the limitations of the out-of-bound writes, and our inability to exploit it, MSRC awarded us with a nice bounty before releasing a fix, four month after our initial report.
Our initial aim was to try whatthefuzz on microsoft RDP clients and we eventually found a bug in another component. Again the vulnerability is not in RDP or its use of d3d10warp. Considering that it is loaded by almost all processes when no 3D hardware acceleration is present, it might be an interesting target for further research.
